Table of Contents:
Introduction to MACD and Crypto Prediction
Cryptocurrency trading can be a wild landscape full of ups and downs. One way traders aim to predict these price swings effectively is through the use of the Moving Average Convergence Divergence (MACD). The MACD is a trend-following momentum indicator that shows the relationship between two moving averages of a crypto asset's price. This introduction will provide you with a sound understanding of MACD and its relation to crypto prediction.
MACD takes the difference between the two exponential moving averages (EMA) of differing periods, then constructs a signal line, which is an EMA of the difference. In layman terms, it is a guide for when to buy or sell. Its accurate readings can often predict impending price reversals, thus giving a trader insight into the possible future of crypto prices.
This article aims to help beginners in the cryptocurrency and finance realm grasp the concept of MACD and its importance in predicting crypto price swings. We will dive deeper into how MACD works and how it can be a powerful tool in your crypto trading strategy.
Understanding MACD
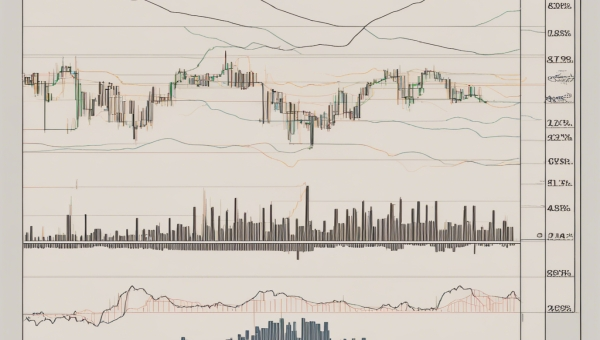
The MACD is made up of two components. The first part, called the 'MACD line,' represents the difference between a 12-period Exponential Moving Average (EMA) and a 26-period EMA. The second component is the ‘signal line,' a 9-period EMA of the MACD line itself. A third, optional, element is the ‘MACD histogram,' which represents the difference between the MACD line and the signal line, depicting it as a bar chart.
When the MACD line crosses above the signal line, it generates a bullish signal, indicating that it might be an opportune time to buy. Conversely, when the MACD line crosses below the signal line, it sends a bearish signal, hinting that it might be an appropriate time to sell. This interplay plays a pivotal role in MACD Crypto Prediction.
The MACD can sometimes give false signals, however. Targeting a good entry point requires more than just this one indicator. Many traders combine it with other tools to strengthen the predictions and create a more robust trading system.
MACD Indicator in Predicting Crypto Price Swings: Pros and Cons
| Pros | Cons |
|---|---|
| MACD signals can identify possible buy and sell opportunities. | MACD might produce false signals due to short-term price fluctuations. |
| A tool for understanding price momentum and direction. | Its effectiveness might decrease in a volatile market. |
| Useful in identifying the end of a trend. | MACD lags behind the price action. |
How MACD Works in Cryptocurrency Trading
In the world of digital currencies, the MACD operates much like it does in more traditional capital markets with some noteworthy differences. Cryptocurrency markets are open 24/7, and as such, the concept of a 'trading day' does not exist in the same way. Issues such as these can impact traditional indicators.
Nevertheless, many traders have found the MACD still provides actionable insights for cryptocurrency. In particular, it helps identify strong, trending periods within the market. When the MACD line crosses above the signal line, traders often interpret this as a bullish signal. On the other hand, a bearish signal occurs when the MACD line crosses below the signal line.
It's important to note that no single tool or process should drive your entire investment strategy. While signals given by the MACD are extremely helpful, they should be supported with other indicators and analysis methods to increase predictive accuracy and reduce risk.
MACD, with its toolset providing a unique viewpoint on price action, can become a transformative part of your crypto trading strategy. Accurate MACD crypto prediction aids in enhancing trading results, reducing the risk of losses and maximizing the potential for gain.
MACD Crypto Prediction Tools
In cryptocurrency trading, having the right tools at your disposal can significantly improve your ability to navigate the market. With MACD being a practical tool for crypto prediction, it's essential to know its two critical components: the MACD line and the signal line.
Specialized tools and platforms for crypto trading often include MACD among their analysis features. These tools use complex algorithms that incorporate the MACD methodology, allowing traders to visualize and use the MACD line and signal line effectively. These lines illustrate the relationship between different moving averages of a coin's price and can indicate potential buying or selling opportunities.
Additionally, educational resources such as webinars, blogs, and tutorials on using MACD for crypto prediction, can enhance your trading skills. It's beneficial to use these resources and learn how to combine MACD with other indicators for a comprehensive trading strategy.
A robust trading strategy based on MACD can offer predictive insights into crypto price swings, potentially offering traders the upper hand in a highly volatile market.
Remember, while MACD is a reliable tool, it is not infallible and should be used as part of a diversified trading approach. No single tool can predict market movements with absolute certainty. Thus, it's the combination of MACD with other analyses and market understanding that makes for a proficient trading strategy.
Case Study: How MACD Predicts Crypto Price Swings

Getting hands-on with the real-world application of MACD in predicting crypto price swings will help cement your understanding. Here, we'll look at a simple case study.
Imagine a scenario where the price of a particular cryptocurrency has been rising for a considerable time. You witness that the MACD line – which has been above the signal line – begins to dip towards it. At the same point, the histogram bars, previously positive, start reducing in size. This could be an early indication that the rapidly rising prices may soon see a slowdown or a possible reversal, a bearish signal. And indeed, after a few periods, the MACD line crosses below the signal line, and a clear dip in price follows. This scenario illustrates MACD's effectiveness in predicting a crypto price swing.
Reversely, if the MACD line has been below the signal line during a lengthy price fall, a slowdown or turnaround could be due. If you observed the MACD line starts rising towards the signal line, and the histogram bars become increasingly less negative, this might give a bullish signal. Once the MACD line crosses above the signal line, it is common to witness a subsequent increase in prices.
Of course, real-world trading scenarios are often more complex and require a comprehensive understanding of MACD, equipped with other trading tools and strategies. These examples, however, serve to demonstrate the MACD crypto prediction potentials in basic trading scenarios.
How to Leverage MACD for Crypto Price Predictions
One of the first steps in using MACD for crypto price predictions is knowing how to read and interpret the indicator. When the MACD line crosses above the signal line, it indicates a potential upward swing in prices, suggesting a buying opportunity. Conversely, if the MACD line slips below the signal line, it signifies a possible downward trend, hinting at a selling point.
However, relying solely on these indicators could lead to misinterpretations. Therefore, to improve the reliability of a MACD-generated signal, it should be used in synergy with other technical indicators. For example, using the Relative Strength Index RSI along with MACD can provide a better prediction of price trends. Combining both gives a more rounded view of market conditions and potential price movements.
To employ MACD effectively in your crypto trading strategy, you should conduct regular market analyses. This involves staying updated with news that could impact the crypto market, tracking market trends, and understanding the implications of these events on your trading decisions. Additionally, continuous learning and adjusting your MACD settings according to your market analysis can elevate your crypto prediction game.
Ultimately, the application of MACD in crypto trading doesn’t guarantee success but can provide valuable guidance during turbulent market conditions. Remember that MACD is merely a tool, and its performance depends on how well you integrate it into your broader trading strategy.
Strengthening Crypto Trading Analysis with MACD

Staying ahead in the game of crypto trading means being up to date with the right tools and strategies. Incorporating the MACD indicator in your toolbox can significantly bolster your trading analysis capabilities.
One distinct advantage of using MACD is its ability to predict short-term price momentum changes. These early warning signs can provide traders a considerable edge in forecasting potential market swings. Here's how it works: When the MACD line shifts above the signal line, it indicates a potential increase in buy pressure. On the other hand, if it swings below, it suggests a rise in sell pressure.
Another potent application of the MACD indicator is identifying divergence between the price movement and the MACD line itself. A divergence occurs when the price trends in one direction while the MACD trends in the other. These occurrences often precede significant price reversals, making it a powerful alert mechanism to take note of in your crypto prediction efforts. However, divergence is a rather rare signal and thus isn't as frequent.
MACD also assists in understanding overbought or oversold conditions. Generally, extended periods where the MACD line resides above or below zero can signify overbought or oversold conditions, respectively. Remember, these conditions might not necessarily lead to immediate reversals. Nonetheless, they provide a sense of the prolonged pressure experienced by a coin.
Combining MACD with other analysis tools like Fibonacci retracements, Relative Strength Index (RSI), or Elliott Wave Theory can create an in-depth and holistic analysis framework. This integrated approach can further improve the robustness of your MACD crypto prediction capabilities, making your trading strategy more resilient and adaptive to market changes.
Ultimately, incorporating MACD in your trading arsenal can uncover deeper insights into market trends, enhancing your decision-making prowess in this volatile yet rewarding market.
Conclusion: MACD's Role in Crypto Trend Forecasting
In closing, the MACD offers a straightforward, yet potent set of tools for cryptocurrency traders striving to predict price trends. It's an insightful gauge for interpreting market momentum and potential price reversals in the complex yet exciting world of crypto trading.
MACD does not assure 100% accuracy; hence, it must complement other market analyses and risk management strategies. The strength of MACD stems from its capacity to promptly react to market changes, providing invaluable buy or sell signals.
As you immerse yourself in cryptocurrency trading, harnessing the MACD can provide an informative snapshot of market dynamics, thus putting you in a favorable position to read, react, and profit from crypto price swings. Be sure to explore other indicators and learning resources to build a strong understanding of this volatile market.
The key to successful trading is continuous learning. Stay updated with market trends, refine your trading strategies, and never stop learning. MACD, when used knowledgeably, can be an extremely useful tool in the toolkit of a successful crypto trader.
FAQ zu Bitopex Analyse und der Rolle von MACD bei der Vorhersage von Kryptowährungspreisschwankungen
Was ist Bitopex?
Bitopex is a cryptocurrency trading platform that provides users with a comprehensive set of tools for successful trading, including the ability to analyze crypto price swings.
Was bedeutet MACD?
MACD stands for Moving Average Convergence Divergence. It is a trend-following momentum indicator that shows the relationship between two moving averages of a security's price.
Wie hilft MACD bei der Vorhersage von Kryptowährungspreisschwankungen?
MACD can help predict crypto price swings by giving traders signals for buying and selling cryptos. When the MACD crosses above the signal line, it's a bullish signal, indicating it may be a good time to buy. Conversely, when the MACD crosses below the signal line, it's a bearish signal.
Was sind die Risiken der Verwendung von MACD für den Handel?
MACD is a lagging indicator, meaning that it is based on past prices. Therefore, it isn't always accurate and can give false signals. Traders should use it in conjunction with other indicators and tools.
Wie kann ich MACD verwenden, um meine Handelsstrategie zu verbessern?
MACD can be used to identify possible entry and exit points, as well as trends in the market. Traders can use it to identify potential bullish or bearish reversals, which can be helpful in planning trading strategies.


