Bar Chart
Bar Chart
Definition of a Bar Chart
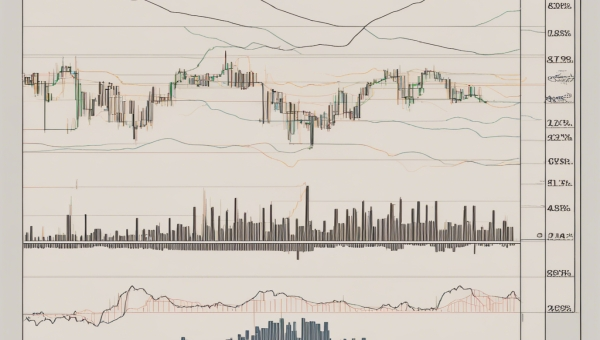
A Bar Chart is a type of graphical representation used in financial markets, including the trading of options with cryptocurrencies. It presents price activity over a specific timeframe, aiding traders in making informed decisions.
Understanding a Bar Chart
A typical Bar Chart consists of vertical bars, each representing price movement during a specified period. Each bar has four important elements: the opening price, the closing price, the high price, and the low price of that period. The top tip of the bar denotes the highest price traded during the timeframe, while the bottom tip communicates the lowest price.
The Meaning of Opening and Closing Prices in a Bar Chart
In a Bar Chart, a horizontal dash on the left side of the bar indicates the opening price, while a horizontal dash on the right denotes the closing price. This allows traders to swiftly interpret the price data, understanding if the cryptocurrency increased or decreased in value during that timeframe.
Advantages of Using Bar Charts in Option Trading with Cryptocurrencies
One of the key benefits of using a Bar Chart in options trading with cryptocurrencies is its ability to provide a visual display of price fluctuations. This enables traders to observe trends and patterns in price movements, thereby facilitating forecasting of future prices. This easy-to-read graphical representation can help to identify lucrative opportunities in option trading with cryptocurrencies.
Conclusion
Understanding how to read a Bar Chart can significantly enhance your options trading strategies, especially in the often volatile cryptocurrency market. This user-friendly charting method offers a wealth of information, making it an essential tool for both novice and experienced crypto traders.
Blog Posts with the term: Bar Chart

Analyzing open interest by strike price in BTC options helps traders identify key support and resistance levels, anticipate volatility, and gauge market sentiment for strategic advantage....

This article provides an introduction to the Moving Average Convergence Divergence (MACD) indicator and its relevance in predicting price swings in cryptocurrencies. The MACD is a trend-following momentum indicator that can help traders determine when to buy or sell based...

Having the right tools for options trading is essential to make informed decisions, save time, manage risks effectively, and gain a competitive edge. Top platforms like Tastytrade, Charles Schwab, Interactive Brokers, Webull, and E*TRADE offer unique features catering to different...

Option trading offers flexibility and strategic opportunities in various market conditions, relying on understanding call and put options as foundational tools. Mastering option chains, key metrics like strike price, premium, open interest, and implied volatility is essential for informed decision-making...